
Math Anxiety Among First-Year Graduate Students in Communication Sciences and Disorders
Jamie Mahurin Smith
Department of Communication Sciences and Disorders • Illinois State University
Department of Communication Sciences and Disorders • Illinois State University

Jamie Mahurin Smith is an assistant professor in the ISU department of communication sciences and disorders. Her research focuses on short- and long-term outcomes for children with perinatal complications such as prematurity. She has taught classes in language development and disorders, neurogenic disorders, and pediatric dysphagia. Her experiences with teaching research methods to graduate students in speech-language pathology were the impetus behind this study.
Students in allied health fields use math for a variety of tasks in their classes and in the field. Math anxiety can interfere with completion of these tasks; no published reports describe the prevalence or extent of math anxiety in this population. Two cohorts of first-year graduate students in communication sciences and disorders (CSD; n = 73) used the modified Fennema-Sherman Mathematics Attitude Survey to evaluate their own math ability and math anxiety. For many of the survey items, a strongly bimodal response pattern was observed. Across both cohorts, one group of students felt confident and competent with regard to math-related tasks, while another group reported anxiety and doubt. The presence of strongly divergent feelings about course material may present challenges for instructors and students alike. Potential responses are discussed.
Keywords: math anxiety, statistics, graduate education
A number of the tasks necessary for successful job performance in the health sciences and in allied health fields (e.g., athletic training, audiology, dietetics, medical technology, occupational therapy, physical therapy, and speech-language pathology) require basic computation skills. These may include calculating chronological ages, quantifying progress within and across treatment sessions, scoring tests, writing reports, or interpreting a colleague’s findings appropriately. One context in which math-related tasks may be particularly prevalent is a graduate course in research methods. The present study was designed to provide baseline data describing levels of math anxiety and self-perceptions of math ability among first-year speech-language pathology master’s students, with the goal of advancing the discussion of best practices for teaching math-related skills in allied health programs.
The American Speech-Language-Hearing Association specifies that all students who complete an accredited graduate degree program in speech-language pathology or audiology must demonstrate “knowledge of processes used in research and the integration of research principles into evidence-based clinical practice” (ASHA, 2014, Standard IV-F). In many graduate programs in communication sciences and disorders (CSD), students are required to take a course in research methods. However, in this author’s experiences as both a student and an instructor, it is not uncommon for students to view the research methods class as a hurdle to be crossed rather than as an opportunity to learn useful and interesting material; this perspective is also described in a 2012 paper by Ekmekci, Hancock, & Swayze. They may regard statistics with particular hesitation, a perspective that may be accompanied by math anxiety.
The question of effective teaching strategies for statistical concepts and calculations has been addressed across many disciplines, including one prior study reporting on some approaches used with CSD master’s students (Ekmekci, Hancock, & Swayze, 2012). Garfield and Ben-Zvi (2007) reviewed the literature on teaching statistics, describing findings from classes of both undergraduate and graduate students. They concluded that students were often slow to acquire statistical concepts and that their retention of these concepts—even the most basic concepts—was poor. Clark et al. (2007) described an investigation in which college students who performed well in introductory statistics were assessed within six weeks of the end of the term. Although every participant had earned an A shortly before the researchers’ assessment, their understanding of basic terms like “mean” and “standard deviation” was tenuous. A subset of the research on statistics learning has investigated the influence of attitude and anxiety. Garfield and Ben-Zvi report that unfavorable attitudes toward statistics courses are widespread among students and may even worsen over the course of a semester-long course. In view of these results, instructors may be encouraged to learn of a further finding reported by Garfield and Ben-Zvi: students’ attitudes toward statistics coursework are not a highly effective predictor of successful statistical learning.
Statistics anxiety and math anxiety are separate constructs with a significant degree of overlap (Baloglu, 1999). The present study was driven by this instructor’s observations of math anxiety among students in CSD classes, a concern corroborated by colleagues both at this institution and elsewhere. Math anxiety is a widespread phenomenon, more common among women than men (Ashcraft, 2002). Unlike statistics anxiety, which is more closely related to logical and verbal reasoning skills (Fullerton & Kendrick, 2013), math anxiety refers to a response elicited by numerical manipulation tasks. It may interfere with the accurate completion of tasks involving numbers; among individuals with high math anxiety, the brain regions associated with mathematical reasoning are less active during calculation tasks (Young, Wu, & Menon, 2012). Math anxiety may prompt avoidance behaviors in addition to a stress response (Ashcraft & Ridley, 2005). These difficulties can affect a wide swath of learners, as math anxiety is distinct from general anxiety and is unrelated to intelligence (Young, Wu, & Menon, 2012).
While it is possible for students to complete numerical manipulation tasks accurately even in the presence of math anxiety, these tasks may be viewed as significantly more burdensome and unpleasant by students with math anxiety. Students’ attitudes, furthermore, have the potential to influence the climate of a classroom; higher anxiety is associated with less favorable learning environments (Taylor & Fraser, 2013). For this reason, the present study was designed to address the following research questions:
- How do first-semester graduate students in a CSD research methods class perceive their math abilities?
- How do first-semester graduate students in a CSD research methods class rate their level of math anxiety at the start of the statistics unit?
Method
This study was conducted with two cohorts of first-semester graduate students in speech-language pathology at Illinois State University (n = 73, 35 from the first cohort and 38 from the second; of the 73 students, 72 were female). Admission to the program is competitive; both cohorts of students had an average undergraduate GPA of 3.8; average GRE scores were 150 (verbal) and 149 (quantitative). Despite this history of strong academic performance, which included successful completion of an undergraduate statistics course, a number of students expressed concern about the skills required for the statistics unit of the research methods class.
The first weeks of the research methods course emphasized concepts such as research questions, research design, and ethical research conduct. A six-week statistics unit reviewed basic calculations such as mean and standard deviation and went on to describe correlation coefficients, regression modeling, chi-square tests, t tests, and analysis of variance. Students were presented with example problems to calculate in ungraded small-group activities during class time, a context that seemed to relieve anxiety for many. For example, they might derive a Pearson correlation coefficient given x and y values for 5 participants (see Figure 1). They were also offered the opportunity to work through online modules if they felt the need for additional practice, although this task was not required. At the beginning of this unit, students completed a shortened version of the Fennema-Sherman Mathematics Attitude Survey (Fennema & Sherman, 1976; modified by Doepken, Lawsky, & Padwa, 1993), which measures perceived competence and confidence on a 1-5 scale, where 1 is “strongly disagree,” 3 is “no opinion,” and 5 is “strongly agree.” Their responses were anonymous. The list of questions can be viewed in the Appendix. They were grouped by the author into three categories: math ability, math anxiety, and math utility.
Results
An initial inspection of the mean values for results of the Fennema-Sherman survey, summarized in Table 1, suggested that responses for most items were fairly close to 3 (“no opinion”). Visual inspection of the distributions, however, indicated that many items had a clearly bimodal response pattern. For many of the items on the instrument, between a quarter and a third of the class responded with 4 (“agree”) while a similar proportion responded with 2 (“disagree”).
Figure 2 illustrates the distributions of responses for the Fennema-Sherman items most clearly aligned with student perceptions of math ability, the first research question under consideration. Almost all of the students agreed that they would be happy to get good grades in math, an unsurprising finding for this sample of motivated students. For all five of the other items, however, a bimodal distribution of responses is evident. While the data are not broken down by cohort, the same pattern is clear across both classes: one subgroup within each class felt competent with regard to math; another subgroup expressed reservations about their abilities.
Figure 3 illustrates the distributions of responses for the items addressing math anxiety, the second research question. (Readers will observe that the division between anxiety and ability is not a tidy one, and some of the items in Figure 3 capture respondents’ perceptions about ability as well as anxiety. This is consistent with what is known about the interplay between anxiety and performance.) The students were divided fairly evenly between those who felt secure about attempting math and those who did not. While most students did not experience math anxiety intensely enough to prevent them from thinking clearly, the large majority, more than 90% of them, disagreed or strongly disagreed with the statement “Math doesn’t scare me at all.” This finding suggests that at least a modicum of math anxiety is widespread among these CSD students. Although Figure 3 shows results for the full sample of 73 students, similarly bimodal results were clear when the results were broken down into separate cohorts.
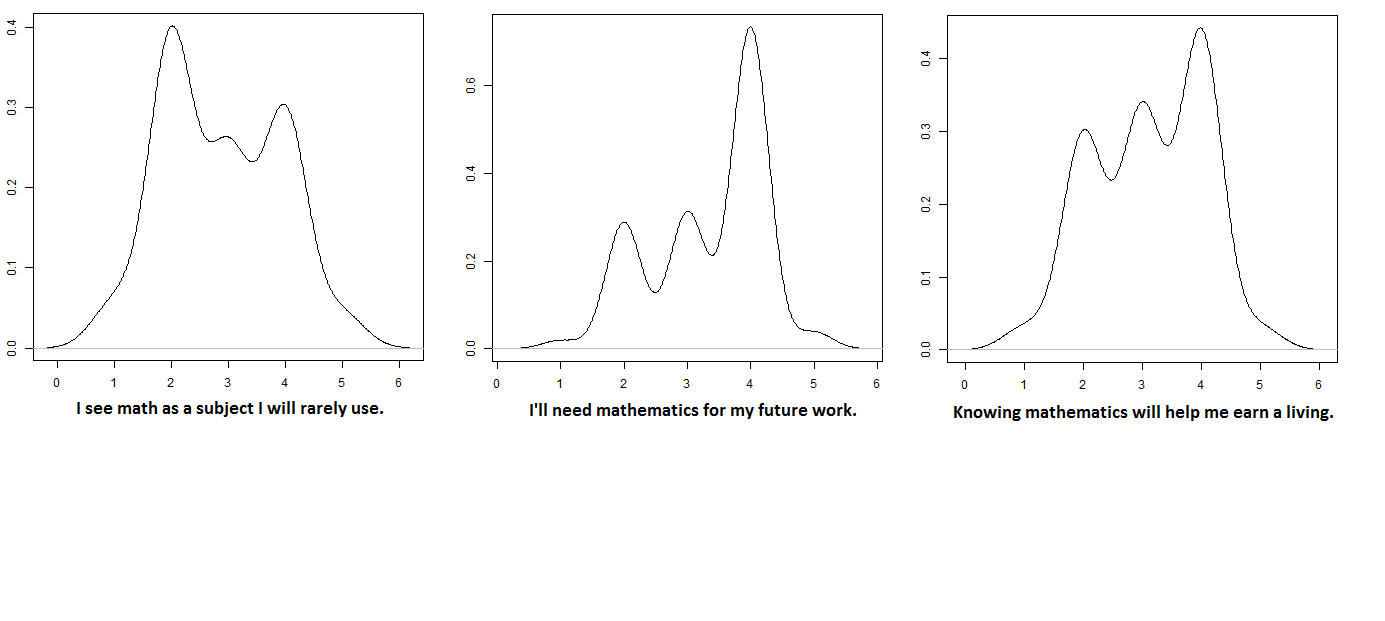
Results for the three remaining items, all of which relate to perceptions of the usefulness of math, are illustrated in Figure 4. All three response patterns indicate that most CSD graduate students in this sample were aware that they would continue to need math skills in their future work.
Discussion
For many items related to math anxiety and perceived math competence, two cohorts of first-year grad students in CSD demonstrated a clearly bimodal distribution of responses. Although the means for 12 of the 15 items fell within a half-point of the center on a 5-point scale, student responses tended to cluster at 2 (“disagree”) and 4 (“agree”), indicating that a more modest proportion of students felt neutral about math. This pattern suggests a division within the classes, with a cluster of students who felt confident and competent with regard to math and another cluster who felt anxious and doubtful (cf. Schumacher & Montgomery, 2013). The author was unable to find other published reports describing similarly bimodal distributions of math anxiety, but correspondence with the author of a study on statistics anxiety (Huchting, 2013) suggests that these findings have been observed among students in other disciplines (K. Huchting, personal communication, February 16, 2015). The following section will discuss potential implications for instructors and students.
Professionals in CSD use math routinely: to derive test results, to assess client accuracy during and after treatment, to make sense of correspondence from other professionals. While calculation tasks related to statistical methods are unlikely to feature prominently in the day-to-day work of clinical service providers, it is nonetheless worthwhile to address the question of math anxiety and its implications for graduate instruction in CSD.
First, instructors may find it useful to know that math anxiety is amenable to intervention. Students who find math anxiety intrusive may benefit from approaches described in the literature to address this problem. Maloney and Beilock (2012) report that students who write about their math anxiety can diminish its impact on their performance. They also assert that instructors can assist students to reframe their reactions to math tasks as an appropriate response to a situation that requires their alertness and engagement: a challenge rather than a threat. Instructors may also wish to keep in mind that the use of humor can defuse negative feelings among students with anxiety (Kher, Molstad, & Donahue, 1999; Berk & Nanda, 1998). Given the prevalence of math anxiety and concerns about math competence in these cohorts of academically strong graduate students, the efficacy of intervention intended to reduce math anxiety is a potentially rich and interesting research topic.
Second, these findings raise questions about the use of calculation tasks in CSD courses including but not limited to research methods classes. Instructors vary in their emphasis on tasks involving numerical manipulation; these differences may arise from a mix of factors, such as institutional culture, an instructor’s own attitudes toward math, and the comparative outspokenness of students on either end of the math anxiety scale. In the author’s view, calculation tasks have the potential to clarify statistical concepts that may remain opaque even after students have been provided with definitions and illustrations. When a correlation coefficient can be reduced to a series of straightforward steps, none requiring sophisticated math skills, a student who has read about Pearson’s r with puzzlement may have a new appreciation for its applications. A carefully constructed example can, of course, highlight its limitations as well. The author has found that students at both ends of the math anxiety continuum responded well to tools provided in optional online modules that they could work through at their own pace. It is important to keep in mind, however, that activation of math anxiety can have a negative impact on math competence (Ashcraft & Kirk, 2001). Providing appropriate levels of support to students across the spectrum may prove to be an ongoing challenge. It is, however, a challenge worth addressing. In view of these results, a research methods instructor who intends to “aim for the middle” pedagogically may actually be focusing on a small fraction—less than 20%—of the class. For this reason, it is prudent to consider the needs of students at each end of the spectrum: providing self-paced, out-of-class support for those who find math more daunting, offering optional enrichment activities for those who find math more appealing, and creating a classroom environment in which frequent questions are welcome.
Existing research into math anxiety suggests that although it is known to respond to intervention, students may not view it as malleable (see, for instance, Schumacher & Montgomery, 2013). In other words, students who struggle with math-related tasks may feel that they will always struggle because they perceive their abilities as relatively fixed, while students who are at ease with math may not grasp the intensity of their classmates’ reactions to tasks that can seem fairly simple. Increasing student awareness of the range of attitudes and ability levels within a class can create a supportive context in which students can appreciate the diversity of their classmates’ perspectives. Recalling that instructor attitudes and approaches can positively influence student perceptions of math ability may facilitate learning as well. Jackson and Leffingwell (1999) provide an overview of this topic, reporting that instructors who were welcoming and accessible, taking care to present material at an appropriate level, were less likely to fuel student anxiety. Schumacher and Montgomery (2013) also point out that being explicit about the links between graduate students’ activities in a statistics classroom and their future professional success is an effective strategy for boosting student buy-in.
This paper has provided baseline data on math anxiety and self-perceptions of math ability among CSD graduate students. While one other published study has considered the performance of CSD graduate students in research methods (Ekmekci, Hancock, & Swayze, 2012), this is the first to assess the extent of pre-existing math anxiety. Given the extensive literature documenting the negative impact of math anxiety on learning, engagement, and retention (Young, Wu, & Menon, 2012; Ashcraft, 2002; Ashcraft & Kirk, 2001), these findings require further investigation. Future directions may also include the response of math anxiety to intervention in this population and the relationship between math anxiety and statistics anxiety among allied health students. Such studies have the potential to diminish math anxiety among students and equip instructors with tools that will allow diverse learners to prepare for their future professional responsibilities.
References
American Speech-Language Hearing Association. (2014, January 1). Standards for accreditation of graduate education programs in audiology and speech-language pathology. Retrieved from http://www.asha.org/Certification/2014-Speech-Language-Pathology-Certification-Standards/
Ashcraft, M. H. (2002). Math anxiety: Personal, educational, and cognitive consequences. Current Directions in Psychological Science, 11(5), 181-185.
Ashcraft, M. H., & Kirk, E. P. (2001). The relationships among working memory, math anxiety, and performance. Journal of Experimental Psychology: General, 130(2), 224-237.
Ashcraft, M.H., & Ridley, K.S. (2005). Math anxiety and its cognitive consequence: A tutorial review. In J.I.D. Campbell (Ed.), The handbook of mathematical cognition (pp. 315-330). New York: Psychology Press.
Baloglu, M. (1999). A comparison of mathematics anxiety and statistics anxiety in relation to general anxiety. Retrieved from ERIC Database. (ED 436 703)
Berk, R. A., & Nanda, J. P. (1998). Effects of jocular instructional methods on attitudes, anxiety, and achievement in statistics courses. Humor, 11(4), 383-409.
Clark, J., Kraut, G., Mathews, D., & Wimbish, J. (2007). The fundamental theorem of statistics: Classifying student understanding of basic statistical concepts. Unpublished manuscript. [Online: http://www1. hollins. edu/faculty/clarkjm/stat2c. pdf].
Ekmekci, O., Hancock, A. B., & Swayze, S. (2012). Teaching statistical research methods to graduate students: Lessons learned from three different degree programs. International Journal of Teaching and Learning in Higher Education, 24(2), 272-279.
Fennema, E., & Sherman, J.A. (1976). Fennema-Sherman mathematics attitudes scales: Instruments designed to measure attitudes toward the learning of mathematics by females and males. Journal of Research in Mathematics Education, 324-326.
Fullerton, J. A., & Kendrick, A. (2013). The math problem: Advertising students’ attitudes toward statistics. Journalism & Mass Communication Educator, 68(2), 134-149.
Garfield, J., & Ben-Zvi, D. (2007). A current review of research on teaching and learning statistics. International Statistical Review, 75, 372-296.
Huchting, K. (2013). Increasing confidence in a statistics course: Assessing students’ beliefs and using the data to design curriculum with students. Journal on Excellence in College Teaching, 24, 29-48.
Jackson, C.D., & Leffingwell, R.J. (1999). The role of instructors in creating math anxiety in students from kindergarten through college. The Mathematics Teacher, 92, 583-586.
Kher, N., Molstad, S., & Donahue, R. (1999). Using humor in the college classroom to enhance teaching effectiveness in ‘dread courses.’ College Student Journal, 33(3), 400-406.
Maloney, E. A., & Beilock, S. L. (2012). Math anxiety: Who has it, why it develops, and how to guard against it. Trends in Cognitive Sciences, 16(8), 404-406.
Schumacher, K. S., & Montgomery, D. (2013). Using identity indicators to describe graduate students’ views of statistics courses in the context of major-specific courses. Operant Subjectivity: The International Journal of Q Methodology, 36(4), 320-334.
Taylor, B.A., & Fraser, B.J. (2013). Relationships between learning environment and mathematics anxiety. Learning Environments Research, 16, 297-313.
Young, C.B., Wu, S.S., & Menon, V. (2012). The neurodevelopmental basis of math anxiety. Psychological Science, 23, 492-501.
Table 1. Descriptive statistics for results of the modified Fennema-Sherman Mathematics Attitude Survey.
| Item | Cohort 1 Mean (SD) | Cohort 2 Mean (SD) | Combined Mean (SD) |
|---|---|---|---|
| I usually have been at ease in math classes. | 2.48 (1.12) | 2.61 (1.15) | 2.55 (1.13) |
| I see math as a subject I will rarely use. | 2.94 (1.03) | 2.82 (1.04) | 2.88 (1.03) |
| I’m no good at math. | 3.26 (1.31) | 2.87 (1.19) | 3.05 (1.26) |
| Generally, I have felt secure about attempting math. | 2.71 (1.20) | 2.92 (1.08) | 2.82 (1.13) |
| I’ll need mathematics for my future work. | 3.57 (0.78) | 3.14 (0.94) | 3.35 (0.88) |
| I’d be happy to get good grades in mathematics. | 4.49 (0.56) | 4.34 (0.88) | 4.41 (0.74) |
| I don’t think that I could do advanced math. | 3.34 (1.39) | 2.95 (1.06) | 3.14 (1.24) |
| It wouldn’t bother me at all to take more math courses. | 2.03 (1.15) | 2.00 (0.96) | 2.01 (1.05) |
| For some reason, even though I study, math seems unusually hard for me. | 3.37 (1.14) | 3.21 (1.21) | 3.29 (1.17) |
| My mind goes blank and I am unable to think clearly when working in mathematics. | 3.00 (1.26) | 2.63 (1.72) | 2.81 (1.22) |
| Knowing mathematics will help me earn a living. | 3.13 (0.93) | 3.16 (0.95) | 3.13 (0.93) |
| Math has been my worst subject. | 3.40 (1.33) | 3.00 (1.45) | 3.19 (1.40) |
| I think I could handle more difficult mathematics. | 2.43 (1.19) | 2.71 (1.06) | 2.58 (1.13) |
| I’m not the type to do well in mathematics. | 3.37 (1.11) | 2.89 (1.20) | 3.12 (1.18) |
| Math doesn’t scare me at all. | 2.09 (1.09) | 2.39 (1.03) | 2.25 (1.06) |
Note: For all items, responses from 1 (strongly disagree) through 3 (no opinion) to 5 (strongly agree).
Figure 1. Example of an in-class group exercise from the statistics unit of the research methods course.
| Patient name | Number of the preceding 90 days for which completion of recommended oral care is recorded in chart | Episodes of aspiration pneumonia in the preceding 90 days |
|---|---|---|
| Alice | 80 | 0 |
| Betty | 70 | 1 |
| Charles | 50 | 1 |
| Della | 20 | 3 |
| Edward | 10 | 4 |
Note: Students might be instructed to graph these values and derive a Pearson’s correlation coefficient in small groups, using instructions provided in class.
Figure 2. Distributions of responses for items related to math ability.
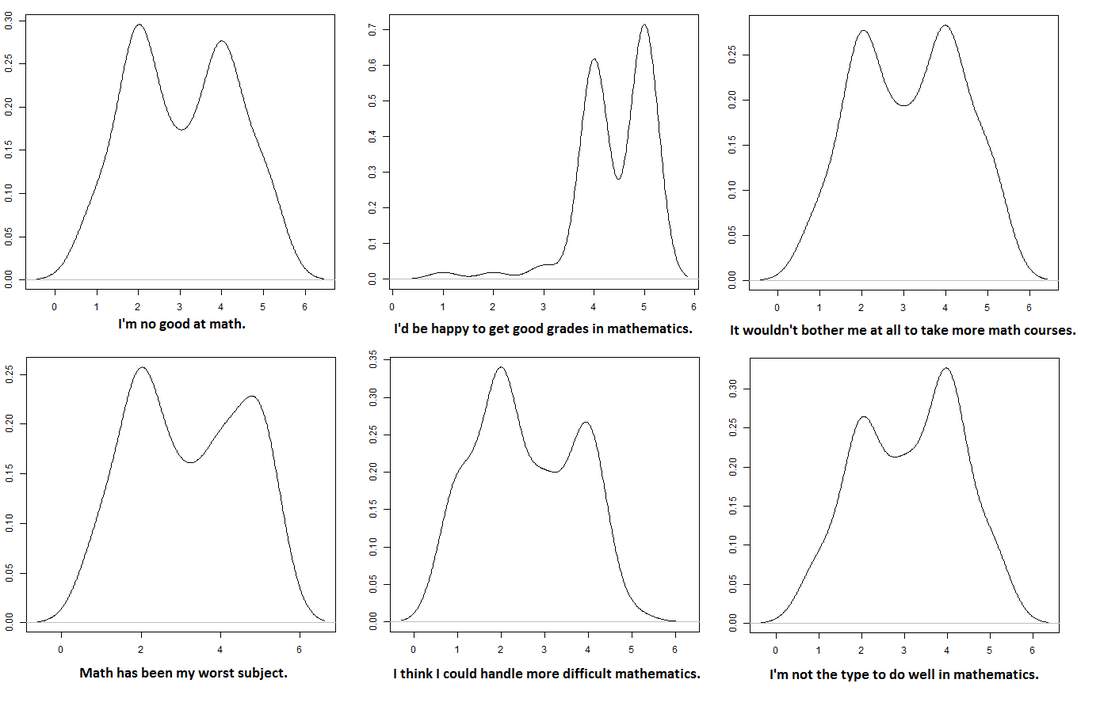
Figure 3. Distributions of responses for items related to math anxiety.
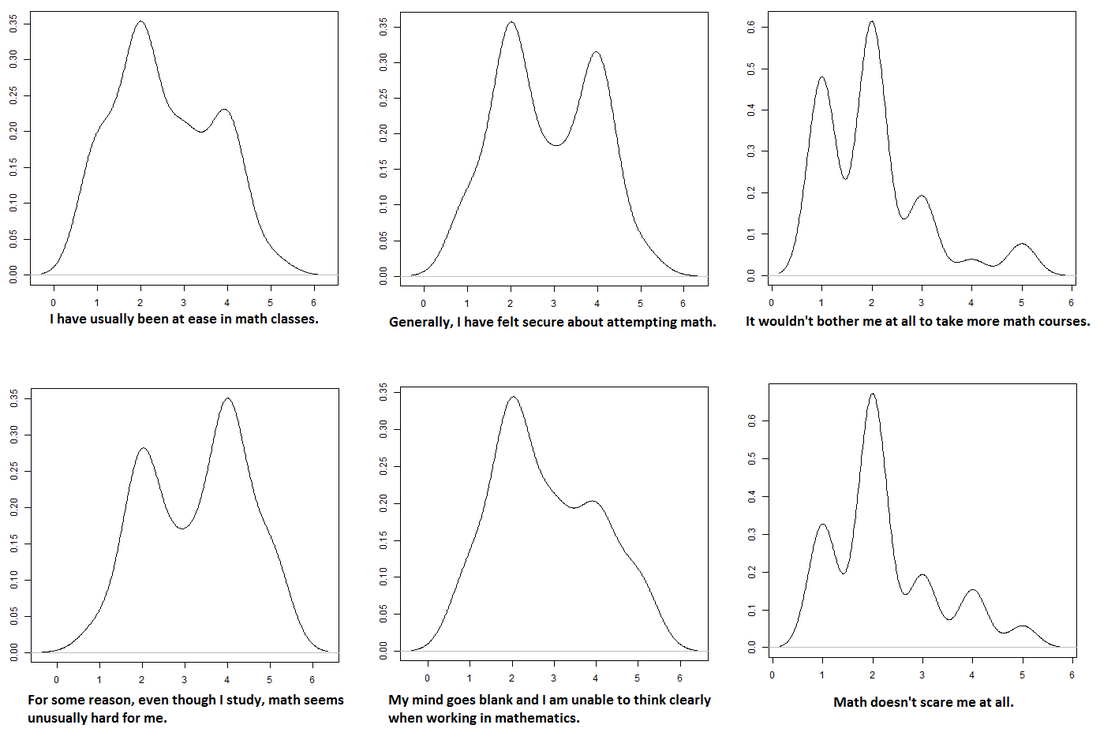
Figure 4. Distributions of responses for items related to the usefulness of math.
Appendix
Mathematics Attitude Survey (modified Fennema-Sherman Mathematics Attitudes Scales)
For each statement circle a number 1-5 which indicates whether you strongly agree (5), agree (4), no opinion (3), disagree (2) or strongly disagree (1).
|
1 | 2 | 3 | 4 | 5 |
|
1 | 2 | 3 | 4 | 5 |
|
1 | 2 | 3 | 4 | 5 |
|
1 | 2 | 3 | 4 | 5 |
|
1 | 2 | 3 | 4 | 5 |
|
1 | 2 | 3 | 4 | 5 |
|
1 | 2 | 3 | 4 | 5 |
|
1 | 2 | 3 | 4 | 5 |
|
1 | 2 | 3 | 4 | 5 |
|
1 | 2 | 3 | 4 | 5 |
|
1 | 2 | 3 | 4 | 5 |
|
1 | 2 | 3 | 4 | 5 |
|
1 | 2 | 3 | 4 | 5 |
|
1 | 2 | 3 | 4 | 5 |
|
1 | 2 | 3 | 4 | 5 |
| Compute the mean for questions 1, 4, 5, 6, 8, 11, and 15: | |||||
| Compute the mean for questions 2, 3, 7, 9, 10, 12, and 14: | |||||
© 2017 Illinois State University
